

Alright guys, so here’s the scene: XAUUSD aka GOLD gave us its weekly closing last Friday, August 01, 2025. The market touched a low of 3267, a high of 3364, and finally gave a strong bullish close at 3362.
Just as expected, after the previous weekly UPTHRUST, Gold took a heavy drop — testing 3267. But the moment it touched that low, demand came in like a desi hero in slow motion, and Gold jumped right back up. It broke last week’s low, then broke last week’s close (3337), and topped it all off by printing a new weekly high at 3364 — and then closed at 3362. Total comeback moment.
So, what does this candle even mean?
This candle could be a SHAKEOUT of weak hands, or even a TEST of SUPPLY. Either way, volume is telling us one thing: this was a Low Effort vs High Result candle. In EVR (Effort vs Result) terms, that’s bullish. If there’s no major supply ahead, we might even go up to retest last week’s UPTHRUST high.
Structure POV:
Market structure has officially flipped bullish on lower timeframes, especially on H1. So until structure breaks — we ride the bull.
Bullish Scenarios:

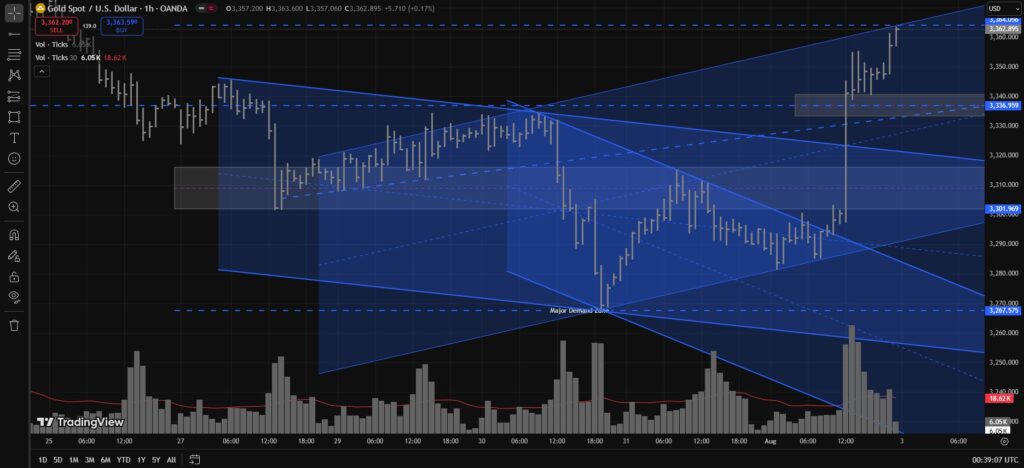
Demand Zone 3340–3330
- Valid till Friday, Aug 08 – 05:00 to 07:00 UTC.
- If Gold drops into this zone within this time window and bounces — structure = intact.
- If Gold drops after this window and breaks 3330, it’s a Sign of Weakness…
…BUT if it comes back up and closes above the Lower Trendline, that’s a SHAKEOUT = Sign of Strength = Long Entry Signal.
Next Demand Zone: 3316–3301
- Valid till Wednesday, August 06 – 02:00 to 04:00 UTC.
- If market visits this zone before that window ends, cool — demand is valid.
- But if Gold comes here after that time, and closes above lower Trendline, it becomes another SHAKEOUT = Long signal.
Trend Logic (Price Structure Game):
- H1 is bullish — so every hour, the lows should keep getting higher.
- For example: If Monday 10:00 UTC, market drops like crazy — even breaks 3301 and touches 3297, no worries…
- As long as it closes above 3297, bullish structure is safe.
- Even if it touches 3290 and closes above 3297, that’s a shakeout of weak hands → bullish signal.
Please note: If XAUUSD aka GOLD tests the mentioned demand zones before the specified time windows, then confirmation is absolutely necessary before taking any long entry — for example, using classic VSA long setups.
Confirm using your own method. Blind entries can be dangerous. Don’t go full Rambo on the charts.
Bearish Scenarios:
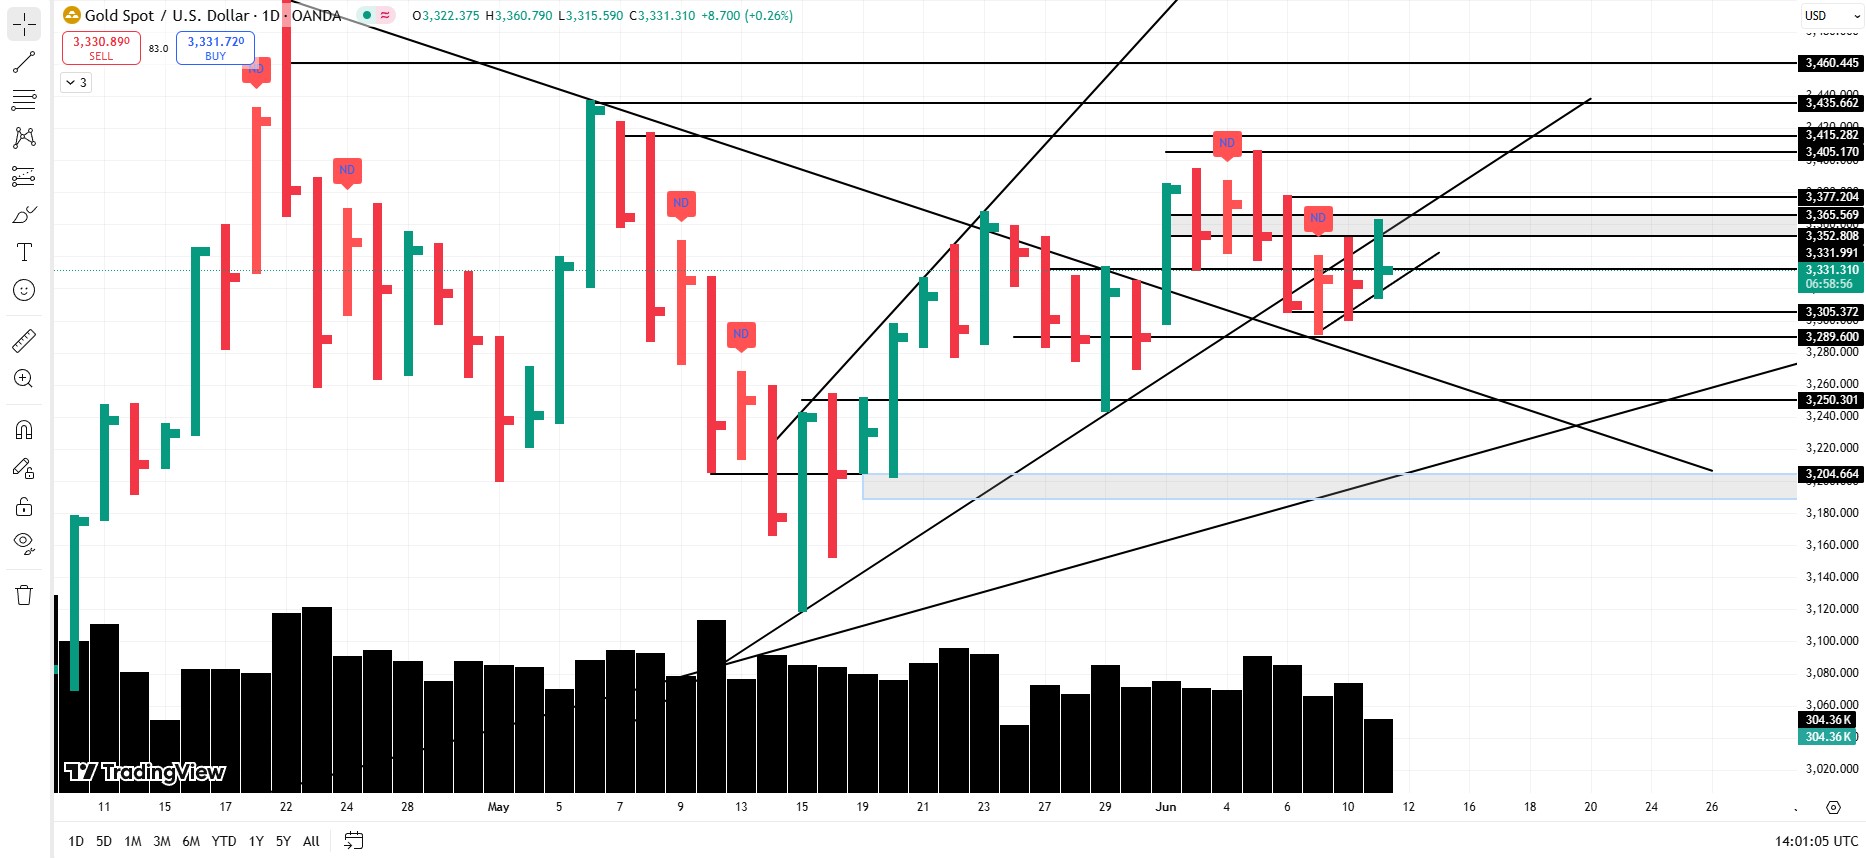
Supply Zone: 3382–3400
- Major supply lives here.
- If Gold gets rejected, bearish pullback is likely.
- If 3400 breaks clean, then previous UPTHRUST high (3440–3444) might get tested.
- So yeah — treat this zone with caution and maybe some emotional distance.
TL;DR:
- Last week’s candle = likely SHAKEOUT or Test of Supply.
- Volume = low effort, high result = bullish hint.
- H1 structure = bullish.
- Two key demand zones:
🔹 3340–3330 (valid till Fri 05:00–07:00 UTC)
🔹 3316–3301 (valid till Wed 02:00–04:00 UTC)
If price reclaims structure after visiting them → bullish entries. - Above 3382–3400 = possible test or breakout to 3440.
Disclaimer:
This ain’t financial advice — just candle gossip dressed like analysis. If you make money — send coffee. If you blow your account — send biryani (I need comfort food too).
And guys please, stop chasing every green candle like it’s your soul mate.
Trade safe. Mark levels. Respect your stop-loss like you respect your mom.
Discover more from MAMKTRADERS.COM
Subscribe to get the latest posts sent to your email.


1 Response
[…] case the upper or lower trendline is broken, do read our Weekly Analysis because it’s highly likely that price may enter our major range and revisit the zones we […]