

Alright people, so here’s the scene: XAUUSD aka GOLD closed the weekly bar (September 1 – September 5, 2025) on Friday, and things got wild. The previous highest high of 3500 is broken, and now we’ve got a new high at 3600. The weekly bar closed strong at 3586 after hitting a low at 3436 and a high at 3600.
And the kicker? This bar was Ultra High Volume (UHV), not just higher than usual, but the biggest in the last 18 weekly bars and also way above MA30 volume. So bulls are flexing, but bears shouldn’t sleep on this.
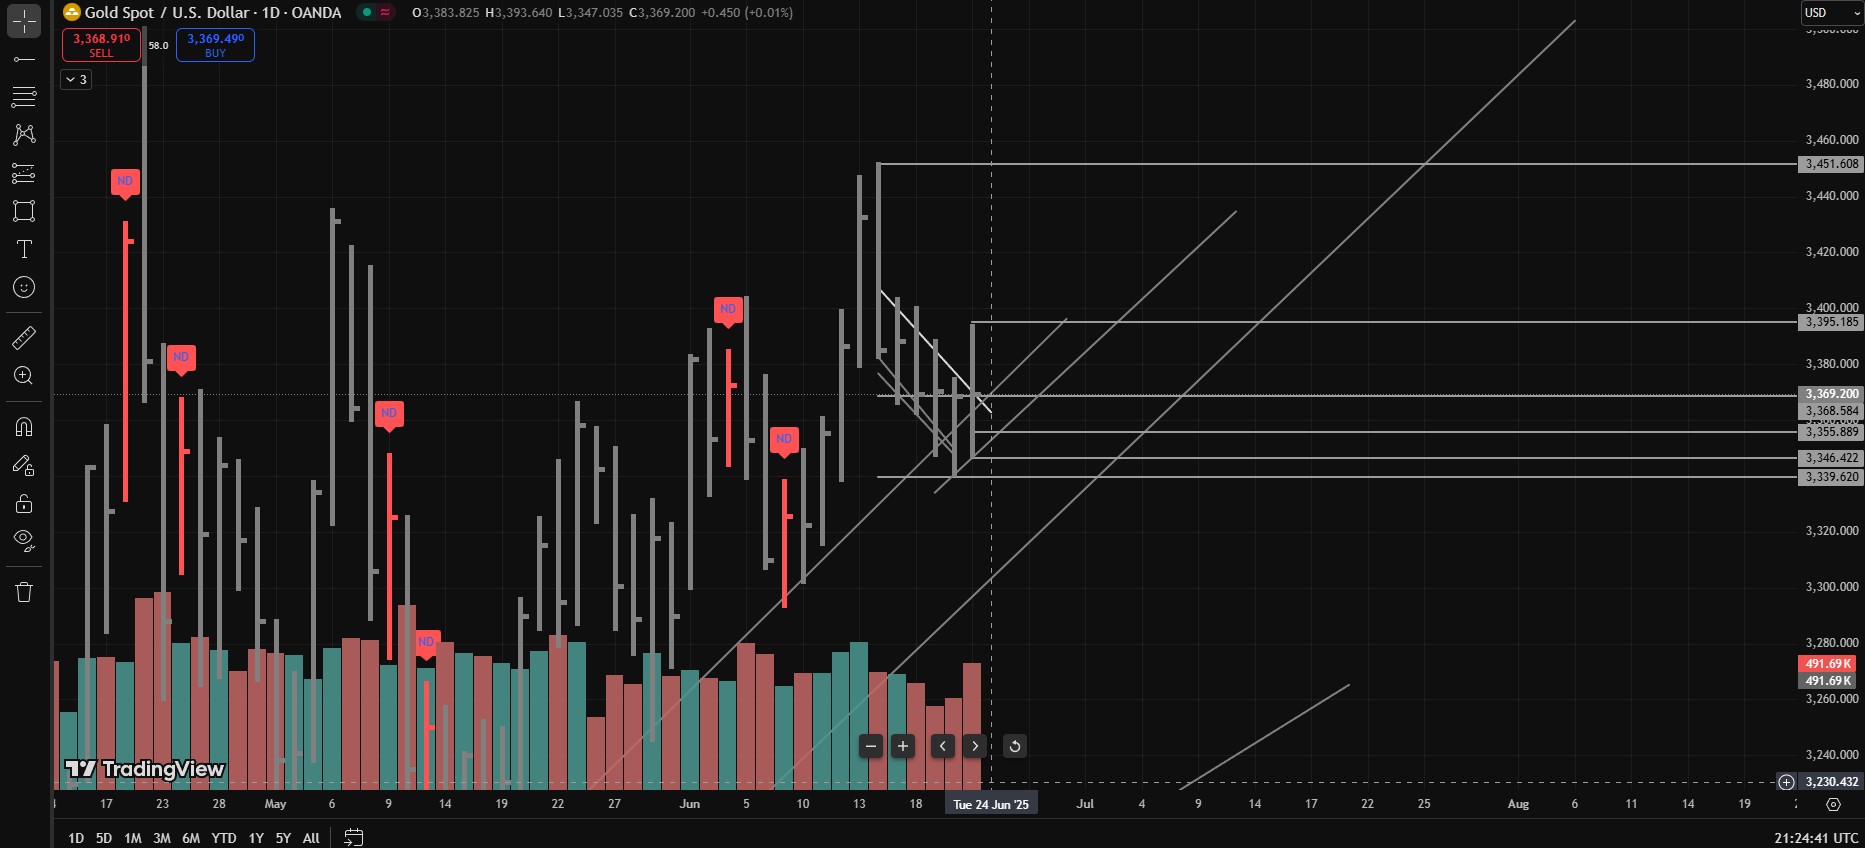
Daily (D1) Scene:
On Friday, September 5, the daily candle showed High Effort vs Low Result. Translation: buying could be exhausted, and a bearish move might be brewing. But since the overall market is still super bullish, Monday could show even more volume and blast through Friday’s levels.
H4 Scene:

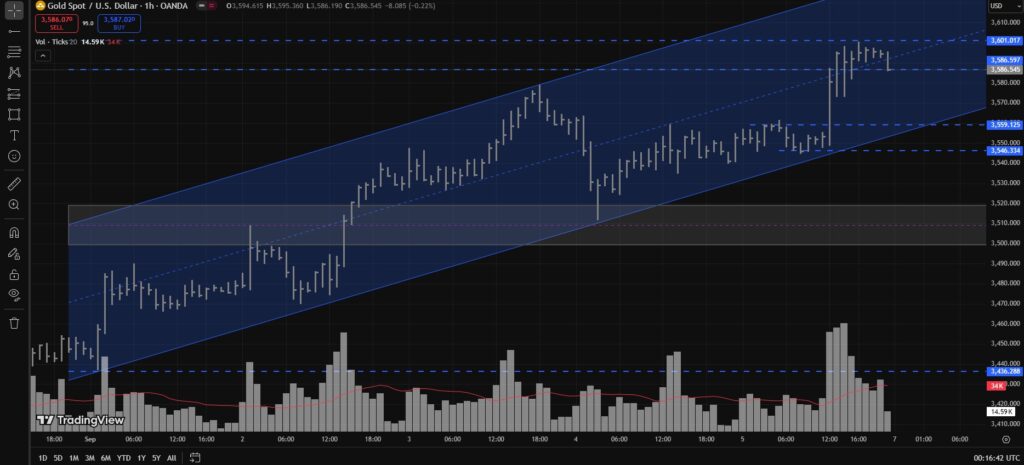
If you zoom into H4, you’ll spot a bullish channel. Draw a line from Monday, September 1 (01:00 UTC) low to Thursday, September 4 (01:00 UTC) low, then extend it up to Wednesday, September 3 high. That’s your current range.
Stretch this channel forward into next week, and boom – you’ve got your future price range. Until we see a breakout, the formula is simple: Buy near the lower trendline, Sell near the upper trendline.
Bullish Plan and Key Levels:
If Gold opens Monday and doesn’t break 3600 but dips to the 3559–3546 zone, that’s a juicy long entry spot.
- Target 1: 3586
- Target 2: 3600
- Target 3: 3630–3640
And if the upper trendline breaks? Even higher, my friend.
Why 3559–3546? Because it’s the first RBS (Resistance Becomes Support) level. If price comes here, rejects, and closes back inside the channel on H4/H1, that’s a classic SOS (Sign of Strength) or a Shakeout move – Smart Money kicking out the weak hands.
If our above scenario fails and Gold breaks 3600 upwards, then wait for the retest at 3600. If it holds as support, buy it – targets 3630–3640 and beyond open up.
Bearish Plan:
As long as 3600 holds as resistance, bears have a shot:
- Short near 3600 with a tight SL.
- First target: 3559
- Second target: 3546
- If broken: next stop at 3518–3499.
- And if even that breaks? Lol, it’s game over for bulls short-term.
Reason? On D1, H4, and H1 you can clearly spot Signs of Weakness (SOW). Until 3600 breaks, a test of 3559–3546 looks highly possible.
But here’s the twist: the 3518–3499 zone is a Fib 50% retracement and a potential demand zone. If the market drops here and then bounces upward, my first target would be 3586, second target 3600, third target 3630–3640, and the fourth target 3700.
TLDR:
- Weekly closed bullish at 3586 with UHV, new high 3600.
- 3559–3546 = key support zone for long entries.
- As long as 3600 holds, bears can aim for 3559 > 3546 > 3518–3499.
- If price bounces from 3518–3499 (Fib 50% Demand Zone) > upside targets are 3586 > 3600 > 3630–3640 > 3700.
- If 3600 breaks upward, retest and go long with 3630–3640+ targets.
- Inside the H4 channel: buy low, sell high until breakout.
Disclaimer:
This ain’t financial advice, bro. Just me pouring my market feelings out. If you follow this and Gold smacks you around, don’t blame me later. Remember: the market doesn’t care about your emotions—so trade at your own risk!
Discover more from MAMKTRADERS.COM
Subscribe to get the latest posts sent to your email.


2 Responses
[…] check my XAUUSD Weekly Analysis for September 8 to September 12, 2025 […]
[…] XAUUSD Weekly Analysis September 8th to September 12th, 2025 […]