

Alright traders, first of all, apologies for not publishing the XAUUSD aka Gold analysis on time. Was a bit busy, so don’t take it to heart.
The Weekly Opening for September 15th, 2025 has happened, and in the previous week Gold (XAUUSD) made a High around 3674, a Low around 3579, and finally gave a Weekly Closing at 3643. Volume was UHV, but slightly lower than the previous Weekly Bar, and the spread was also shorter compared to the last Weekly Bar.
From a long-term perspective, Gold is trading very high right now. I would not suggest buying at these current levels.
Daily Timeframe Analysis

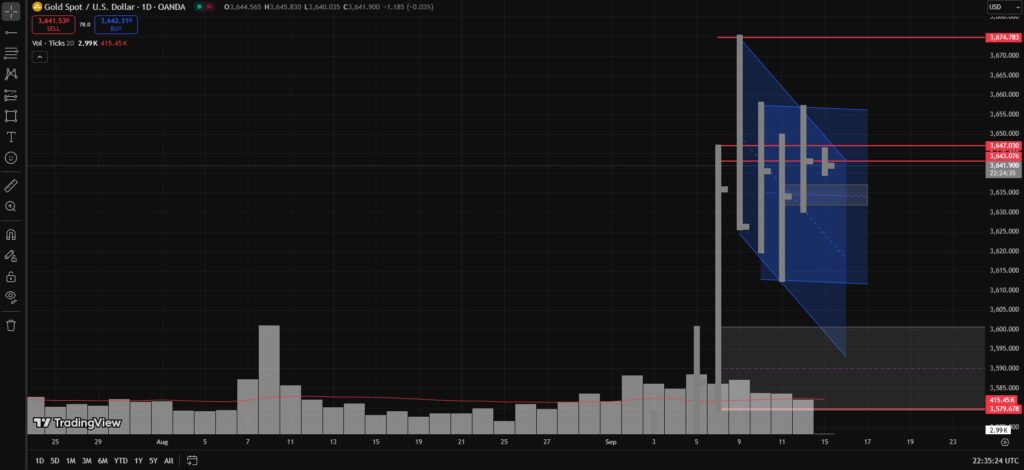
On the Daily timeframe, Friday (September 12th) price action was quite weak, and the closing was still inside Monday (September 8th) Daily Bar’s High.
Breaking down the previous week into Daily Bars:
- Monday (Sep 8): Wide Spread Up Bar with a strong close and UHV volume, slightly lower than Friday (Sep 5).
- Tuesday (Sep 9): Classic Upthrust. Price broke above Monday’s High, made a new High, but then closed near its Low and also below Monday’s High and Close.
- Wednesday & Thursday: Volume was still UHV but much lower than Monday and Tuesday, and it started to decrease. Market price tried to break Monday’s High multiple times, but every time it got rejected and closed below Monday’s High.
- Friday (Sep 12) Potential No Demand Bar: Volume dropped below MA30. Price again briefly broke Monday’s High but closed below it. Importantly, Tuesday’s Upthrust High was never tested throughout the week.
H4 Timeframe Analysis

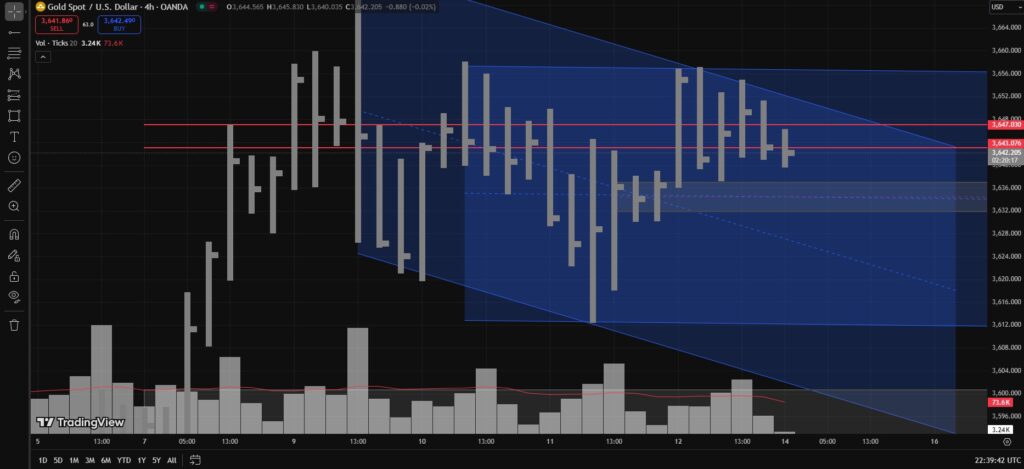
On the H4 timeframe, we can clearly see two ranges – one bearish and one sideways.
- Bearish Range: Start from the Upthrust High on Sep 9, 2025 (UTC 13:00 H4 bar), connect it to the Sep 12, 2025 (UTC 05:00 H4 bar High). Point C is Sep 11, 2025 (UTC 09:00 H4 bar). That gives you the bearish channel. Extend it into next week and you’ll get the potential bearish range.
- Sideways Range: On H4, take the Sep 10, 2025 (UTC 09:00) High for the Upper Trigger Line, and Sep 11, 2025 (UTC 09:00) Low for the Lower Trigger Line. That’s your sideways range.
So the idea is pretty simple, bhai:
- Sell near the Upper Trendline
- Buy near the Lower Trendline
Bullish & Bearish Scenarios
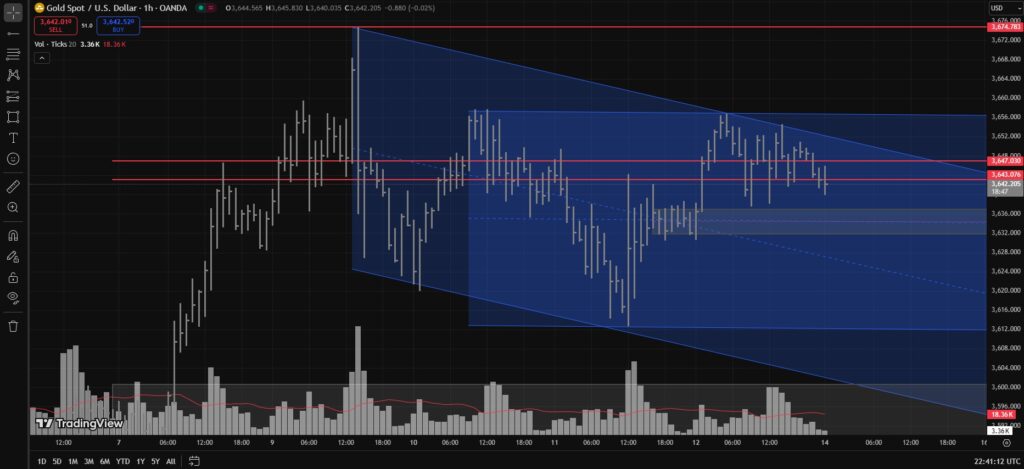
If we get a bullish breakout of both ranges, then on the retest first target will be 3674, and if that breaks, the second target will be 3700.
On the bearish side, if the upper trendlines remain intact, then targets will be:
- First: 3638–3631
- Second: 3622–3616
- Third: 3611
- Fourth: 3601–3579
And that is it for now, this was my Gold (XAUUSD) Weekly Analysis for September 15 to September 19, 2025. This is not financial advice, just pure chart talk.
TLDR
Gold is way too high right now. Two ranges are active – bearish and sideways. Play the range: sell near the top, buy near the bottom. If bullish breakout happens > 3674 then 3700. If bearish side plays out > 3638 > 3622 > 3611 > 3601–3579.
Also read our previous Analysis below:
Disclaimer
This ain’t financial advice, bro. Just me pouring my market feelings out. If you follow this and Gold smacks you around, don’t blame me later. Remember: the market doesn’t care about your emotions—so trade at your own risk!
Discover more from MAMKTRADERS.COM
Subscribe to get the latest posts sent to your email.


1 Response
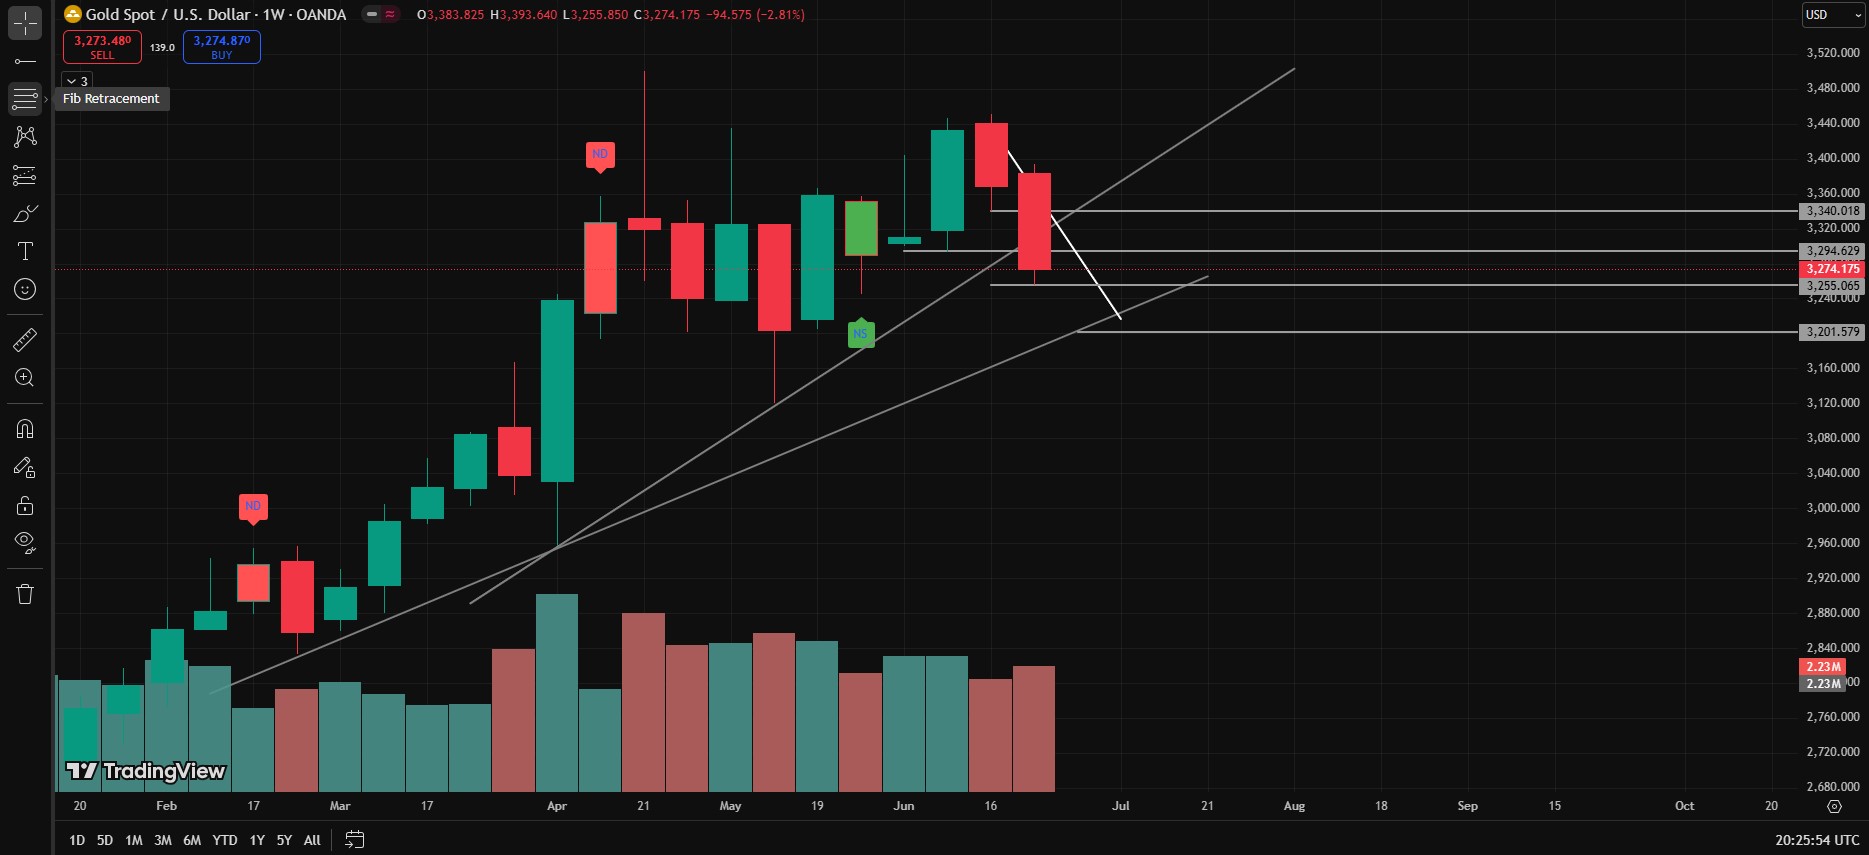
[…] previous week (Sept 15–19, 2025) Gold made a Low around 3626, a High around 3707, and finally closed at 3684 with Ultra High Volume […]