

Alright traders, here’s the fresh update for Gold (XAUUSD). Monday, September 15th, 2025 has closed, and Gold created a new High.
On Monday, Gold made a Low around 3626, a High around 3685, and finally closed at 3678. Importantly, Gold broke out above the September 9th Upthrust High, created a new Highest High, and closed just below it at 3678.
H4 Timeframe Analysis
Zooming into the H4 timeframe, we can identify the most recent Demand Zone (Support Level) at 3674. This can also be considered the very first RBS (Resistance Becomes Support) level if you’re viewing on bar or candlestick charts.
However, if we filter out the noise, the clean first RBS level comes in at 3655.
H1 Timeframe Analysis

On the H1 timeframe, there’s another RBS level at 3663, which sits above 3655.
That makes the 3663–3655 zone a very critical Demand Zone. If Gold breaks below 3674, demand could still step in around this 3663–3655 area.
In case 3655 also breaks down, there’s another RBS / potential Demand Zone around 3646. This is where Gold could still find demand and bounce upward.
Bullish Channel & Shakeout Scenario
Even without breaking 3674, Gold can continue moving higher.
But if 3674 breaks, a long setup could still be seen around 3663–3655. If even 3655 breaks, then as long as price remains within the bullish channel, the 3651–3646 zone could still be a buying area.
This type of move would often be a Shakeout, where Smart Money drives price down sharply to flush out weak hands, only to close back above the support levels. This is considered a Sign of Strength (SOS) in VSA terms.
Structural Shift Level
The key level to watch is 3626 (Monday’s Low).
If 3626 breaks, that would signal a Change of Character (CHOCH) under SMC concepts, meaning the structure shifts bearish, and from there, we’d look for bearish setups instead of bullish ones.
Expected Intraday Behavior
If Gold wants to test the 3646 level while staying inside the bullish structure, then after Tuesday’s opening, it should fall early, ideally by UTC 01:00 hrs, break into 3655–3646, and then close back above on UHV (Ultra High Volume) on the H1 timeframe.
That type of bar would form a Spring or Shakeout, which is again considered a bullish SOS.
Confirmation Reminder
These levels give us the roadmap. But confirmation is always necessary before entering—whether that’s a Climactic Bar, Shakeout, No Supply, or No Demand. The field traders watching live price action must confirm these signals themselves. I can give you the levels, but you have to confirm the signals.
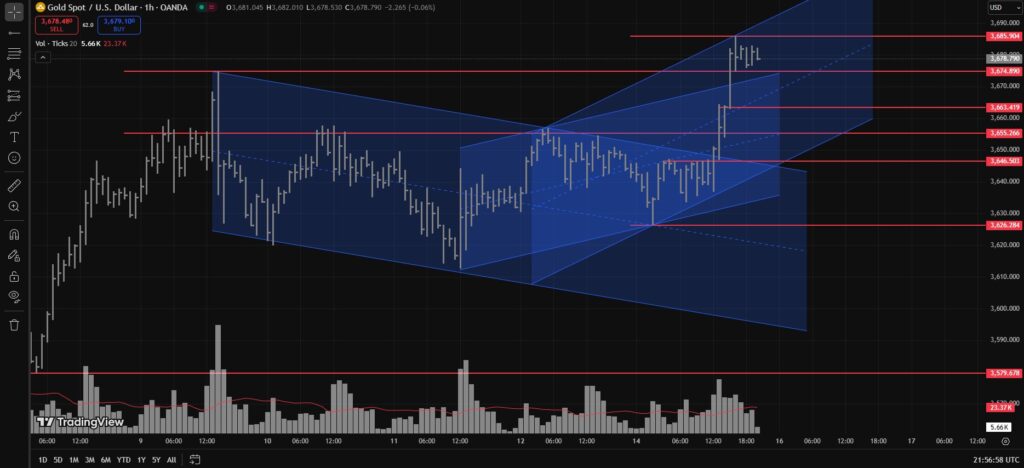
Current Bullish Channel Setup
On the H1 timeframe, draw a bullish channel starting from:
- Point A – September 12th, 2025 (UTC 04:00) High
- Point B – September 15th, 2025 (UTC 16:00) High
- Point C – September 15th, 2025 (UTC 01:00) Low
Extend this channel into the coming days. As long as this bullish channel remains intact, the plan is simple:
- Buy near the lower trendline
- Sell near the upper trendline (riskier than buying, since bias is bullish)
TLDR
- Monday closed at 3678, breaking the previous Sept 9 UPTHRUST’s High.
- Key support levels: 3674 > 3663–3655 > 3646.
- Watch for Shakeout moves (SOS) near these levels for long setups.
- If 3626 breaks, structure shifts bearish (CHOCH).
- Current bias: Bullish inside channel → Buy dips near lower trendline.
Disclaimer
This is just me talking charts with too much caffeine in my system. Don’t sell your house, your car, or your cousin’s goat to trade based on this analysis. If you do, and Gold decides to karate-kick your account, that’s on you, bro. Trade safe, or the market will roast you alive.
Discover more from MAMKTRADERS.COM
Subscribe to get the latest posts sent to your email.


1 Response
[…] XAUUSD (Gold) Intraday Analysis – September 16, 2025 […]