
Alright folks, let’s talk BTCUSD. Today I decided to take a closer look at Bitcoin and analyze what it might do in the coming days post September 9, 2025.
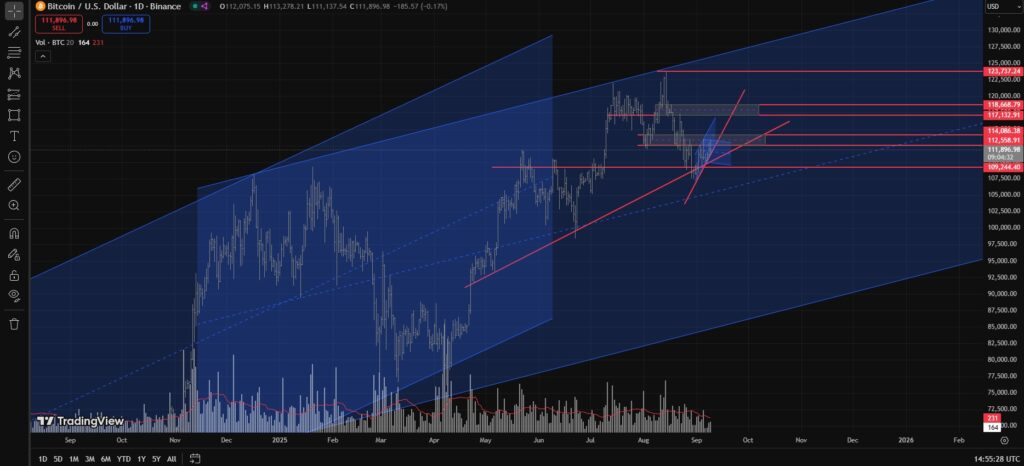
Weekly Outlook
Since the Weekly Bar of March 13th, 2023, BTCUSD’s volume activity has been very low. This tells me that big players, aka Smart Money, are holding large positions. And since then, BTCUSD has been strongly bullish.
Now, if we look at the most recent range:
- On the Weekly Chart, draw a bullish channel starting from the December 16th, 2024 Weekly Bar High, extend it to the July 14th, 2025 High, and then anchor Point C at the April 7th, 2025 Low.
- This gives us the current bullish Weekly range.
- As long as this range remains intact, the idea is simple: Buy near the lower trendline, Sell near the upper trendline.
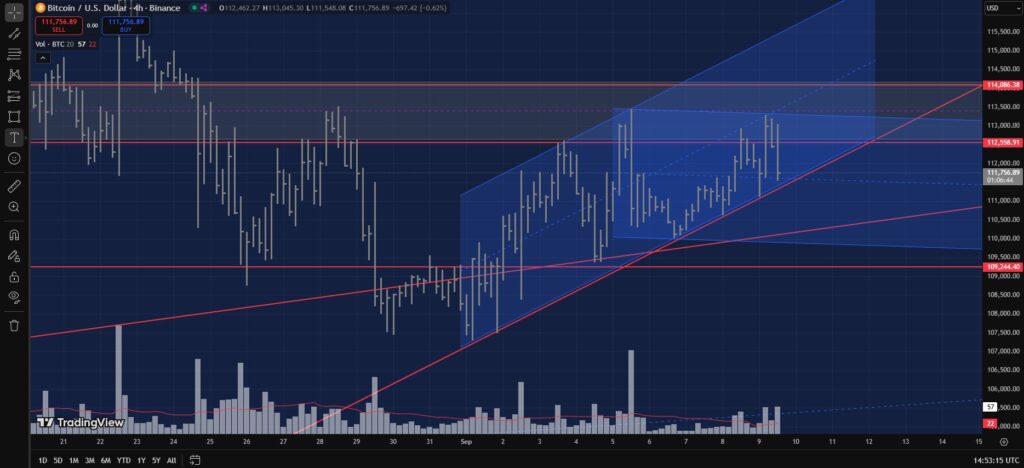
Daily Outlook
Zooming into the D1 timeframe:
- BTCUSD is currently bouncing off the RBS (Resistance Becomes Support) Level at 109,244, while struggling to break above the SBR (Support Becomes Resistance) Level at 112,558–114,086.
For BTC to continue its bullish path and test or break the major channel’s upper trendline:
- A bullish breakout above 112,558–114,086 is absolutely necessary.
- If successful, the next Supply Zone (resistance) lies at 117,132–118,668.
- A breakout there opens the way towards 123,000–124,000 or even the Upper Trendline of the major channel.
On the Bearish side
- For BTC to move down and test the lower trendline of the major channel, it must fail at 112,558–114,086, OR spike up to 117,132–118,668 and form an Upthrust-type Daily Bar (closing near the lows).
- However, last Weekly Bar’s volume didn’t really show strong supply pressure. That’s why I lean towards a spike into 117,132–118,668, since supply at 112,558–114,086 looks weak.
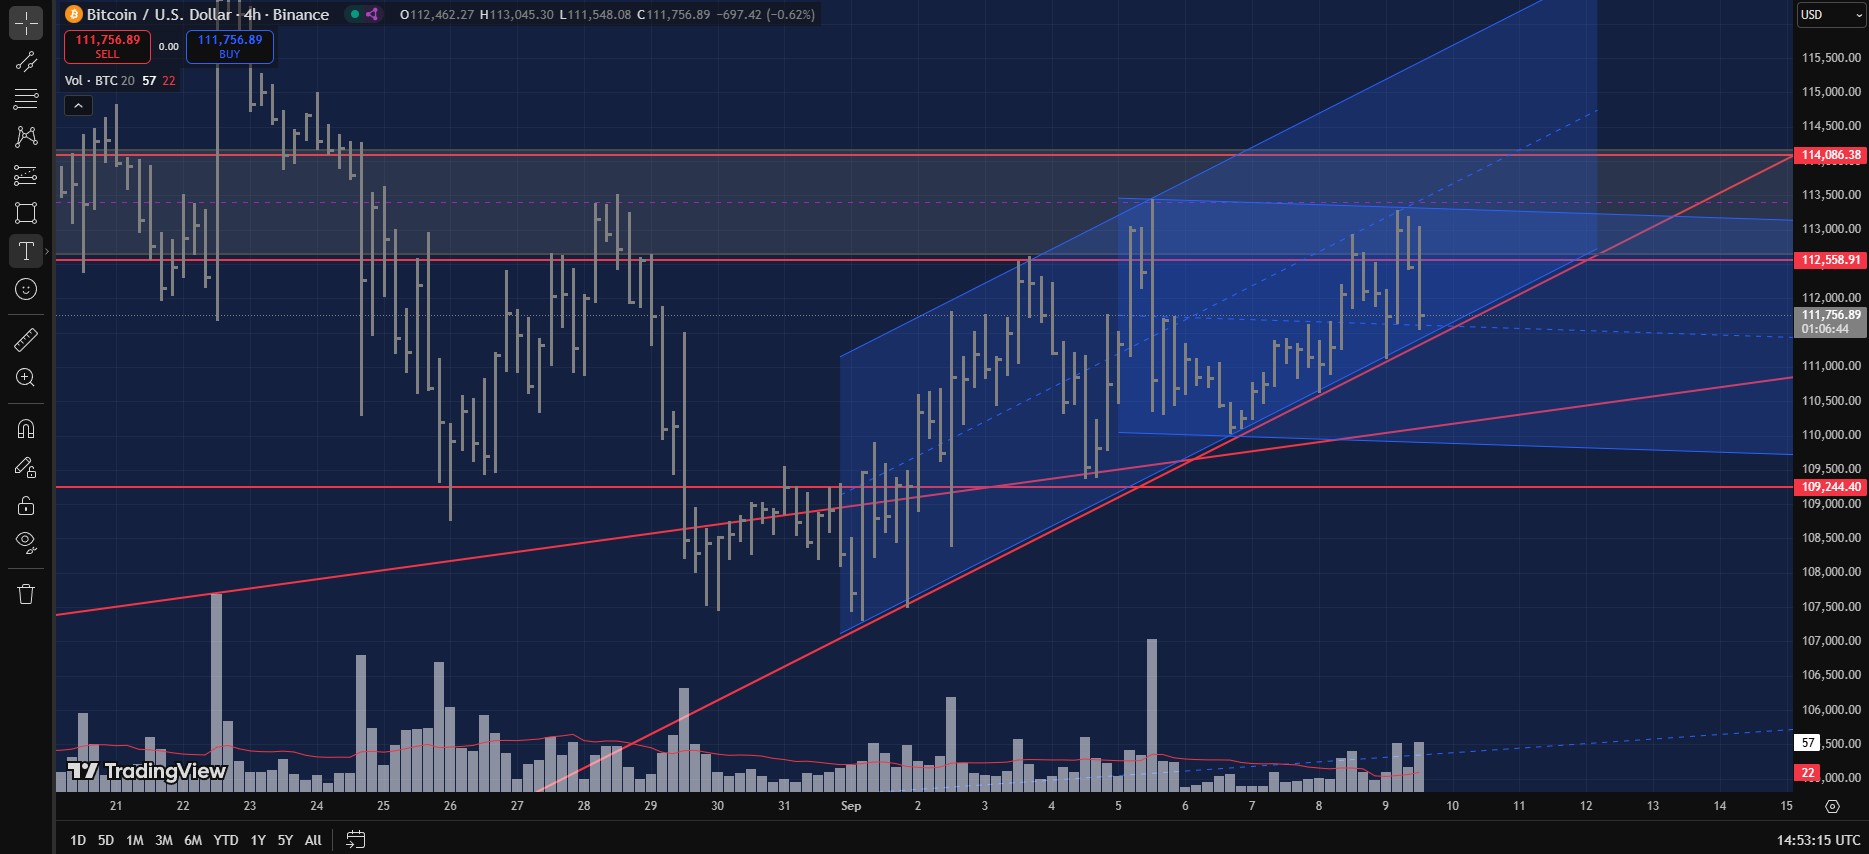
H4 Intraday Outlook
Zooming into H4 timeframe:
- Momentum is bullish.
- Price has rejected the 112,558–114,086 level about three times but keeps pushing higher.
- This looks like Supply Absorption to me, which often signals accumulation before a bullish rally.
H4 Range Setup
- Start from the September 1st, 2025 UTC 04:00hrs Low, extend to the September 9th, 2025 UTC 00:00hrs Low, and take Point C from the September 5th, 2025 UTC 12:00hrs High.
- This defines the current H4 range.
Given this setup, BTC’s H4 price action really does look like Supply Absorption. Could this mean Bitcoin is gearing up for another big bullish rally? However, if the H4 Lower Trendline breaks down bearishly, then that’s a whole different story.
Let me know what you think in the comments below.
Also check our Latest Analysis below:
- ETHUSD Analysis Post September 8th, 2025
- XAUUSD Weekly Analysis September 8th to September 12th, 2025
TLDR
- Weekly: Bullish channel intact > Buy near lower trendline, sell near upper.
- Daily – Bullish Case: Breakout above 112,558–114,086 opens targets at 117,132–118,668, then 123,000–124,000.
- Daily – Bearish Case: Failure at 112,558–114,086, or a spike to 117,132–118,668 followed by an Upthrust close near lows, could send BTC back toward the lower channel trendline.
- H4 – Bullish Case: Repeated rejections looks like Supply Absorption > It could be a possible bullish rally setup.
- H4 – Bearish Case: A bearish breakout of the H4 Lower Trendline would invalidate the bullish setup and shift momentum downward.
Disclaimer
Warning: This analysis was powered by coffee, memes, and way too many candlestick charts. If you lose money following it, blame Bitcoin, not me. If you make money, remember who kept you entertained.
Discover more from MAMKTRADERS.COM
Subscribe to get the latest posts sent to your email.