

Alright folks, so here’s the thing: I saw a potential long-term bearish setup forming on EURUSD, so I felt like I should report it.
Testing the Major Upper Trendline
So friends, the scene is something like this: this week EURUSD has tested its major upper trendline and an Upthrust (Sign of Weakness) is forming on the weekly chart. The weekly close has not happened yet, and of course, confirmation will only come after the weekly close, but EURUSD, after testing the upper trendline, has come back to around 1.17840+, and is currently trading there.
How to Draw the Trendline?
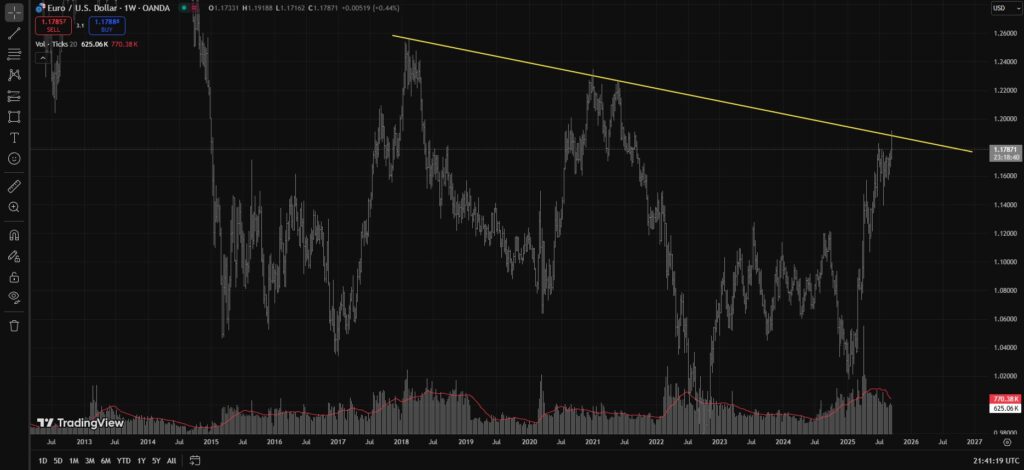
To draw this trendline, go to EURUSD’s weekly chart, take the February 12, 2018 weekly bar’s high, and draw a trendline from there. Extend it all the way to the December 28, 2020 weekly bar, then extend the same trendline toward the May 24, 2021 weekly bar, and from there, extend it all the way to the September 15, 2025 weekly bar and beyond. This way you will get your potential Supply Zone aka Resistance Level.
First Upthrust – February 2018
Now if we look at EURUSD’s monthly chart, the weekly bar we used to start our trendline comes from February 2018, and on the monthly chart, February 2018 is the first Upthrust. It broke January 2018’s high, but then closed even below January 2018’s closing price, with volume higher than January’s bar and spread shorter than January’s bar.
EURUSD Second Upthrust – January 2021
The second Upthrust came in January 2021’s monthly bar, where EURUSD’s price slightly broke the December 2020 monthly bar’s high and also gave a slight fake breakout of the trendline, but then closed below December 2020’s monthly bar’s closing price, with volume higher than December 2020’s monthly bar and spread shorter than December 2020’s bar.
EURUSD Current Test – September 2025
Now EURUSD’s market price has once again tested the same trendline and has gone down, almost a small fakeout happened, but then price went back below the trendline on both the monthly and weekly chart. Although for the monthly closing there are still about 10 or 11 days left, the weekly closing is today, September 19, 2025.
- If by today’s weekly close, EURUSD gives an Upthrust type closing, then we could see a down rally in EURUSD.
- On the monthly chart, the September closing should be at least below 1.16818 for confirmation.
- On the weekly chart, I can see a Shakeout Move on the July 28, 2025 weekly bar, and the current weekly bar should at least close inside the high of that Shakeout Move bar for confirmation.
Targets If Bearish Case Plays Out
Suppose our analysis is valid and EURUSD starts falling, then the potential downside targets would be:
- First Target: 1.14035 – 1.12347
- Second Target: If 1.12347 breaks bearish, then 1.08850
- Third Target: If 1.08850 also breaks bearish, then 1.05800 and more if bearish momentum continues.
Alternative Scenarios for EURUSD
Apart from the above scenarios, EURUSD’s market can also test 1.20 and even 1.22668 before falling, but remember, if EURUSD is going to fall, then for confirmation, EURUSD must give a weekly or monthly closing below our drawn trendline.
And of course, if EURUSD gives a clean bullish breakout above 1.23500, then I can’t fight the market—it’s game over for the bearish case.
Also have a look at our previous analysis:
- XAUUSD (Gold) Intraday Analysis – September 16, 2025
- XAUUSD (Gold) Weekly Analysis – September 15 – 19, 2025
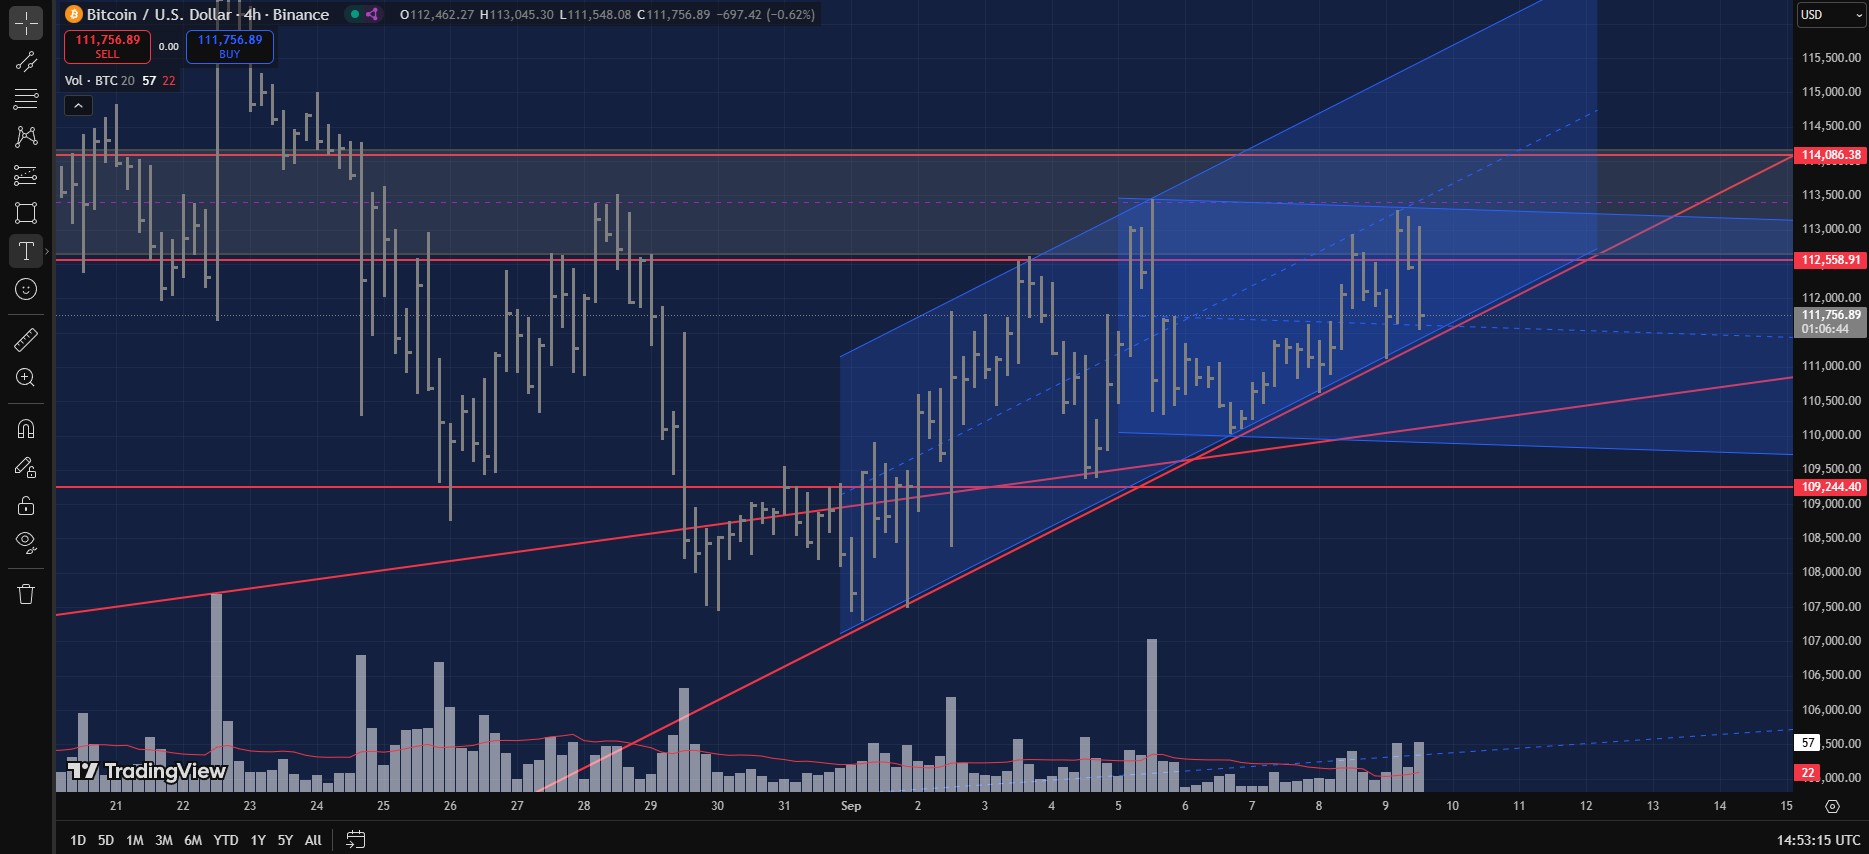
- BTCUSD-Post-September-9-2025
TLDR:
- EURUSD tested its long-term upper trendline.
- An Upthrust (Sign of Weakness) is forming on the weekly chart.
- Confirmation levels:
- Weekly close inside July 28, 2025 Shakeout high
- Monthly close below 1.16818
- Price may still test 1.20 – 1.22668 before falling.
- Breakout above 1.23500 invalidates this setup.
Disclaimer:
This is just me talking charts with too much caffeine in my system. Don’t sell your house, your car, or your cousin’s goat to trade based on this analysis. If you do, and EURUSD decides to karate-kick your account, that’s on you, bro. Trade safe, or the market will roast you alive.
Discover more from MAMKTRADERS.COM
Subscribe to get the latest posts sent to your email.