
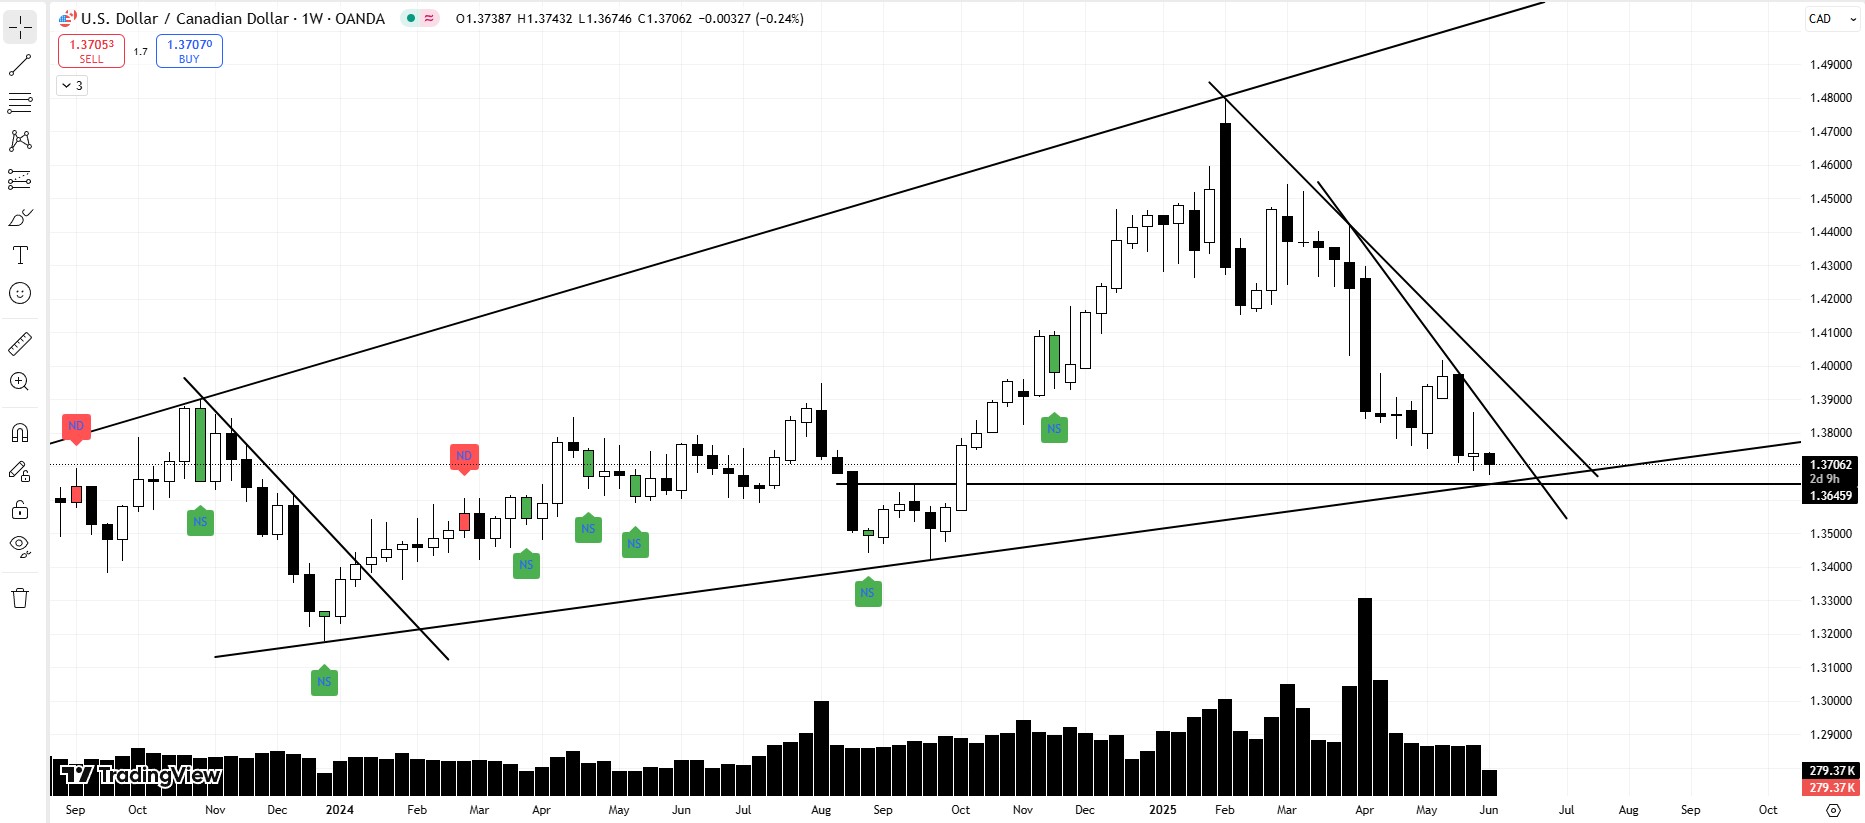
So here’s the tea: our beloved USDCAD is chilling around 1.37+, pretending like everything’s fine, but we all know there’s drama brewing near a juicy RBS (Resistance Becomes Support) zone between 1.36459 – 1.36000.
Now, don’t be fooled – this isn’t just any support zone. This bad boy used to be a stubborn resistance from August 19 to October 8, 2024, until price finally gave it a reality check and broke out on October 9, 2024. Since then, it’s been waiting patiently for a retest, like an ex who thinks you’ll come crawling back.
But that’s not all. USDCAD’s been walking the ramp like a model since November 1st, 2023, flaunting Higher Highs and Higher Lows, all while strutting in a sleek ascending channel. Yup – it’s giving bullish runway vibes.
Let’s rewind:
- Nov 1, 2023: The OG High – the trend said, “I’m alive!”
- Dec 27, 2023: Market gave us a Higher Low – classy.
- Then it started playing hide and seek with some internal structures, trying to confuse us (and succeeding, let’s be honest).
- Finally, in late Oct 2024, we saw a BOS (Break of Structure) of the Nov 2023 high, but the breakout was so weak it might as well have been on a diet.
- The real breakout party started in Nov 2024, and by Feb 3, 2025, we were sipping piña coladas at 1.48 – that’s the new Higher High.
But here’s the twist: drawing the upper trendline was like chasing a ghost because price kept making internal moves. Meanwhile, the lower trendline stood strong like a stubborn desi dad – especially after the Sep 24, 2024 Higher Low.
Now, price is approaching that RBS zone we talked about – which, plot twist, crosses the lower trendline like a crossover episode of your favorite drama. Will it bounce? Will it break? Will it ghost us?

Let’s speculate wildly:
- Market already flirted with 1.36750 two days ago – might bounce right here.
- Or it could go full drama mode and test the RBS zone below.
- Worst case? It throws a tantrum, breaks both the RBS and the lower trendline – and boom: SOW (Sign of Weakness) alert.
My crystal ball (which may or may not be a Magic 8 Ball) says:
If the price respects the RBS zone and reverses, this week we might see a breakout of 1.39 – major SOS (Sign of Strength).
If not, next week it might try 1.38.
Still nothing? Third time’s a charm at 1.3750.
But if the price breaks below the RBS and the trendline, then congratulations – we enter the “what now?” phase of analysis (and probably mild panic).
Financial Disclaimer:
Calm down, I’m not your financial advisor. I don’t know your risk tolerance, your broker, or what kind of tea you drink. This is educational analysis flavored with sarcasm and caffeine. Trade at your own risk – or don’t. I’m just here for the charts and giggles.
Discover more from MAMKTRADERS.COM
Subscribe to get the latest posts sent to your email.