

Alright folks, here’s the scene for XAUUSD aka Gold. The weekly closing for August 15, 2025, is now in the books. Last week, Gold hit a High around 3402, dropped to a Low of 3329, and finally ended the week at 3335.
Compared to the previous week, this was a Low Effort vs High Result strong down close. By that, I mean there was no significant buying pressure visible in last week’s run. The volume was much lower than the previous week’s strong upward close, and the spread of this week’s bar was much wider than last week’s narrower spread. I hope you catch my drift.
Now, if we zoom out to the bigger market structure: since the April 22, 2025, Highest High at 3500, Gold has only been forming Higher Lows and Lower Highs again and again. So far, the market hasn’t broken any of its previous Higher Lows or made fresh Higher Highs. The gap between these Higher Lows and Lower Highs is shrinking. This means one of two things is about to happen:
- Either the market will break downwards out of this tightening range.
- Or we’ll see a bullish breakout to the upside.
But, comparing the weekly bar from August 11–15 with the one before that, the range is still looking bearish. And my bias for next week (August 18–22) also remains bearish. Even if we add one more previous week into the comparison, the bias still stays bearish. That older bar does look like a Shakeout, but the volume was still similar to the latest closed bar.
Now, not sure if all this technical jargon makes sense to regular folks or not, but whatever… Lol.
Here’s what I see:
- Around 3344–3345, there’s a clear SBR (Support Becomes Resistance) level, which looks like a potential Supply Zone.
- If price breaks above 3344–3345, the next ideal Supply Zone sits at 3365–3375.
Trading logic:
If Gold breaks above 3344–3345 and bounces up to the 3365–3376 zone, then that area could be a really good short entry, with downside targets as follows:
- 1st Target: 3345–3344
- 2nd Target: 3330–3329
- 3rd Target: 3318–3310
- 4th Target: 3301–3300
- And more if bearish momentum keeps running.
Now, switching down to the Daily Timeframe:
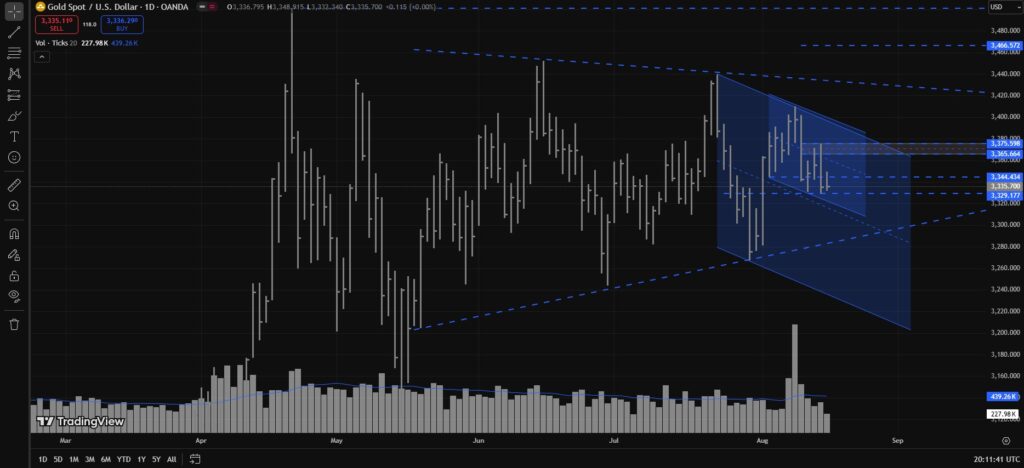
The 3330–3329 Support Zone is very important. As long as this zone holds, Gold can bounce higher. In fact, if that zone holds, price can break 3344–3345 and even test the 3365–3376 Supply Zone.
Why? Because Thursday (August 14) and Friday (August 15) both closed at 3335. Thursday printed a wide spread down bar with high volume (though still under the 30-day average). Friday, on the other hand, had the lowest volume in the last 28 daily bars and closed with a narrow spread. That kind of bar gave me serious “Test of Supply” vibes — basically, a weakening of supply.
In Simpler Words:
As long as 3330–3329 holds, Gold can push bullish, potentially breaking 3344–3345 and testing 3365–3376. But the real warzone between buyers and sellers will be at 3365–3376. Current VSA suggests that bears have higher odds of winning that battle — but hey, if volume picks up stronger, maybe the buyers pull a surprise win.
Gold – XAUUSD Major Trend
And if we zoom out to the bigger picture: this 3334–3326 zone is actually the RBS (Resistance Becomes Support) level of the July 30, 2025 Higher Low in the major trend. This level broke out on August 1, 2025, and since then, price has already tested it three times:
- First test was on August 12, which led to a push up toward 3375.
- Second test came on Thursday with a wide spread down bar.
- Third test was on Friday with a narrow spread bar, upper wick, and the lowest volume in the last 28 bars (as I mentioned earlier).
Now, why is my bias still bearish despite this? Because the background remains heavily bearish. If we step back and look at the August 8, 2025 Daily Bar, that bar showed the highest Ultra High Volume (UHV) since 2022 on the OANDA chart. Such volume hadn’t appeared since 2022. And yet, despite that record volume, the bar closed as a narrow spread up close. That screamed “trap” to me — and rightfully so, because the very next bar confirmed with a heavy drop.
Also, the key point here is that 3375–3376 marks the low of that August 8 daily bar. Its lower trigger line has already been tested once on Thursday, but it’s highly likely that another drop could come again from around 3375.
In simple words, for my bearish bias to flip, the failure of August 8 trigger lines is absolutely necessary.
Anyway, that’s my XAUUSD aka Gold Weekly Analysis for August 18 to August 22, 2025. Please note: this is not financial advice — just me recording some weak moments with my charts.
Until next time, stay safe and blessed and of course, never lose hope.
TL;DR:
- WEEKLY CLOSED at 3335, HIGH was 3402, and LOW was at 3329.
- Market Structure since April HH (3500): Higher Lows + Lower Highs tightening into a wedge.
- Bias for Aug 18–22 = Bearish because background still bearish after Aug 8 UHV trap bar.
- Key Support is at 3330–3329 (also July 30 Higher Low RBS zone, tested 3 times)
- Important Supply Zones are at 3344–3345 (SBR Level), then 3365–3376 (FIB LEVEL, August 8’s Low is at 3376).
- Trading Idea: Short setups favored near 3365–3376; downside targets 3345 > 3330 > 3318 > 3300 and more if drop continues.
- VSA Context: Friday = Test of Supply (ultra low volume) but Aug 8 = UHV Buying Climax trap → still bearish background.
Disclaimer:
This isn’t financial advice. If you follow this and make money — send me coffee. If you follow this and blow your account — send me biryani. I’ll need comfort food too.
Remember, respect your stop-loss like you respect your mother, and don’t chase every shiny Bar or Candle like it’s your soulmate.
Discover more from MAMKTRADERS.COM
Subscribe to get the latest posts sent to your email.