

Get ready, traders – Gold (XAUUSD) looks like it’s gearing up for a massive move, after last week’s Wide Spread+Ultra High Volume (UHV) close, Gold is knocking hard on the $3896 resistance, and if that level breaks… well, $4000 might not be far away.
This XAUUSD Weekly Analysis (Oct 6–10, 2025) dives into the latest VSA insights, channel structures, and key Support aka Demand zones to help you catch the next big wave – before it happens.
XAUUSD – Gold Weekly Analysis
Alright folks, as you already know – XAUUSD (aka GOLD) closed the week of September 29 to October 3, 2025 with a strong bullish weekly close, exactly as expected.
The Friday, October 3rd weekly candle printed Ultra High Volume (UHV) — even higher than the previous 24 weekly bars on ICMarkets.
It was a High Effort vs High Result bar, meaning both effort and progress were in harmony — a sign of genuine bullish strength, not just hype.
During the week, Gold marked a high near 3896, a low around 3763, and closed the week at 3886 — right near the highs.
XAUUSD Daily Analysis
Zooming into the Daily chart:
We can see visible resistance (aka supply) around 3895–3896, but that resistance looks weak.
Friday, October 3rd’s candle was a Low Effort vs High Result bar — meaning price climbed higher with relatively little volume effort, suggesting that resistance is thinning out and supply has been absorbed.
In simpler terms:
Supply started showing up around Wednesday, October 1st, but by Friday, most of that supply appears to be absorbed.
The strong close near the highs with low effort shows that Gold may be gearing up for a breakout above 3895–3896, as the remaining resistance looks fragile.
H4 Timeframe
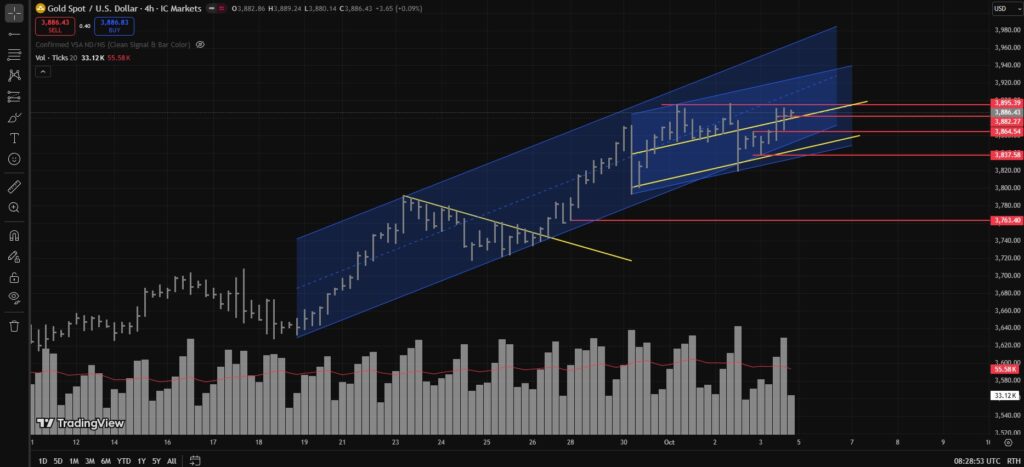
Zooming further into the H4 timeframe, the bullish channel range drawn in the previous analysis is still intact.
On October 2nd, 2025 (UTC 14:02), there was an attempted bearish breakout below the channel’s lower trendline — but price quickly rejected and closed back inside the channel, confirming it was just a Shakeout (SOS) of weak hands.
Yes, there are visible double tops near 3895–3896, but following that shakeout, most (if not all) of the supply seems to be absorbed.
The last three H4 candles do show a bit of exhaustion, suggesting some temporary weakness, but even if price dips, a bounce from 3867–3864 is highly likely — potentially leading to a breakout above 3895–3896 soon after.
XAUUSD H1
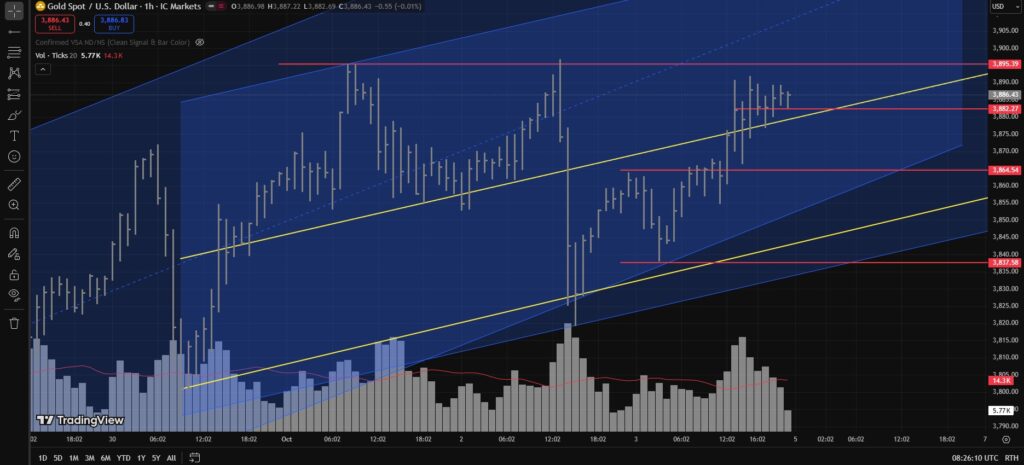
On the H1 chart, Gold could also bounce from the 3882–3879 zone, as short-term buyers are likely to step in there.
For now, there are no strong bearish signals visible. A bearish outlook will only come into play if we get a confirmed breakdown below 3837.
Until that happens — the bias remains bullish.
If Gold decides to drop anyway… well, it’s Gold — it does what it wants.
TLDR
- Weekly Close: 3886 (Strong UP Close)
- Volume: WideSpread+Ultra High Volume (UHV) – higher than last 24 weekly bars on ICMarkets
- Bias: Bullish as long as 3837 holds
- Key Resistance: 3895–3896 (likely to break soon)
- Potential Demand Zones aka Support Levels: 3882–3879 and 3867–3864
- H4 Range: Bullish channel intact – buy near lower trendline, target upper range
- Bearish watch: Only below 3837
Disclaimer
This analysis is just me vibing with charts and sipping chai – not financial advice.
If you decide to mortgage your house, pawn your cat, or sell your cousin’s wedding ring to go all-in on XAUUSD… and Gold decides to nosedive just to humble you – don’t send me angry messages.
Trade safe, or Gold will personally teach you what humility feels like.
Discover more from MAMKTRADERS.COM
Subscribe to get the latest posts sent to your email.