
Alright folks, here’s the fresh XAUUSD Weekly Analysis for Sept 29-Oct 3, 2025. This breakdown covers key ranges, VSA signals, and targets to watch as Gold sets up for its next big move.
During the week of Sept 22–26, 2025, Gold printed a high near 3791, a low around 3680, and finally closed at 3759 for the week.
- On the OANDA chart, volume was Ultra High Volume (UHV) above the MA30 but with less effort compared to the previous three weeks.
- On the ICMarkets chart, volume actually showed higher effort than the prior two weekly bars.
- On the Gold Futures (GC1!) chart, we saw very high effort volume – in fact, higher than the previous 18 weekly bars.
Based on this, I’d consider Gold Futures (GC1!) volume more reliable than OANDA or ICMarkets this time, since their volume reads look misleading.
Daily Timeframe Breakdown
Zooming into the Daily:
- Sept 23, 2025 (Tuesday): All three charts (OANDA, ICMarkets, GC1!) showed Supply entering.
- Sept 26, 2025 (Friday): On GC1! chart, the daily bar showed Low Effort vs High Result (EvR), meaning Tuesday’s supply was most likely absorbed. Resistance looks weak, but not fully gone.
- OANDA & ICMarkets also showed reduced effort, but with mid-bar closes, suggesting weak supply remains.
H4 Timeframe Analysis

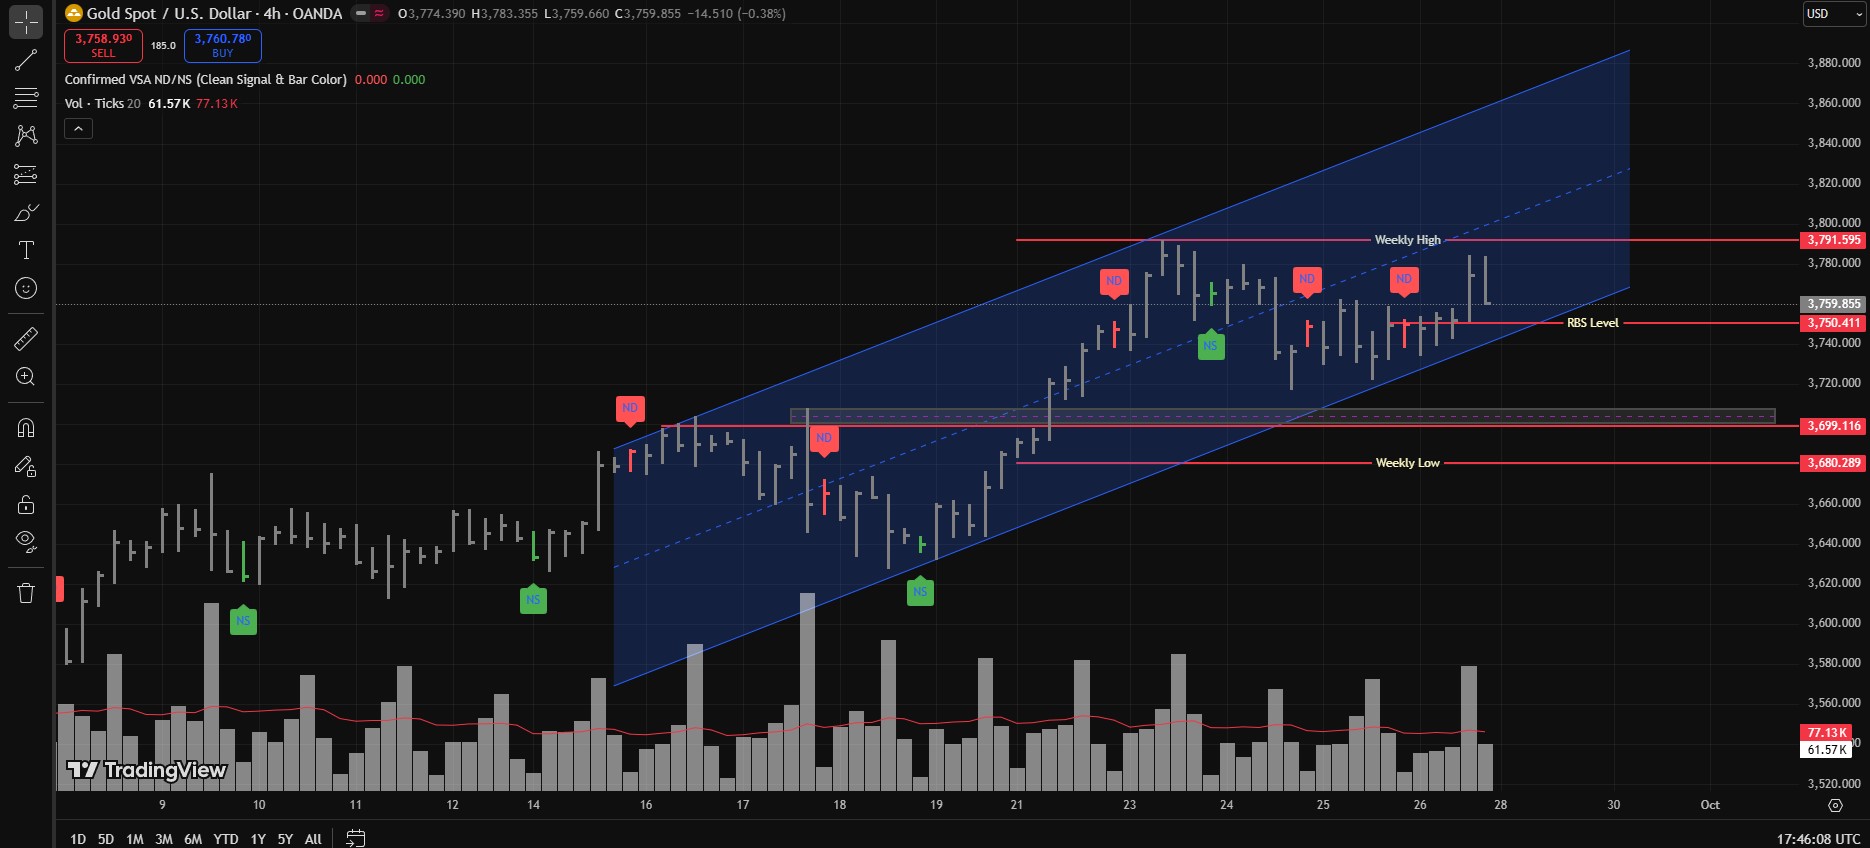
Looking at OANDA’s H4 chart, we can clearly map out the current bullish range:
- Start by drawing a bullish channel from Sept 16, 2025 – UTC13:00 (H4 High) to Sept 23, 2025 – UTC09:00 (H4 High).
- Anchor it with Point C: Sept 19, 2025 – UTC01:00 (H4 Low).
- Extend this channel forward – that’s your active trading range.
As long as this range holds, the play is simple:
- Buy near the lower trendline.
- Sell near the upper trendline.
- A breakout above or below will invalidate this channel.
H1 Timeframe Analysis
On the H1 chart, Gold is trading around its first RBS level at 3750.
- If XAUUSD tests 3750 and VSA signs appear (e.g., No Supply, followed by a Shakeout/Spring, or a Two-Bar Reversal), this could offer a strong long entry.
- Potential upside targets:
- 3791–3800 (1st target)
- 3815–3820 (2nd target)
- 3840–3850 (3rd target)
- Finally, if all of these break, the upper trendline of the H4 range comes into play.
If 3750 breaks down, the next key RBS level is 3710–3700, which is a major demand zone.
If 3710–3700 also breaks, then… well, we’ll cross that bridge when we get there. For now, the key supports remain intact.
TLDR
- Weekly Close: 3759, bias remains bullish as long as 3710–3700 holds.
- Volume: GC1! (Gold Futures) shows most authentic data → higher than last 18 weekly bars.
- H4 Range: Defined bullish channel, buy near bottom, sell near top.
- H1 Levels: Key RBS at 3750 > next potential Demand Zone aka Support Level at 3710–3700.
- Upside Targets: 3791–3800 > 3815–3820 > 3840–3850 > H4 Upper Trendline.
Please Note
This analysis is for XAUUSD (Spot Gold), not Gold Futures. I only used GC1! (futures chart) to read the volume because OANDA and ICMarkets volume are misleading at the moment.
Disclaimer
This is just me vibing with charts, not financial advice. If you decide to YOLO your rent money, sell your bike, or borrow your grandma’s gold bangles to go all-in on XAUUSD… and Mr. Market decides to uppercut you straight to margin call city — don’t send me angry DMs. Trade safe, or Gold will personally humble you.
Discover more from MAMKTRADERS.COM
Subscribe to get the latest posts sent to your email.