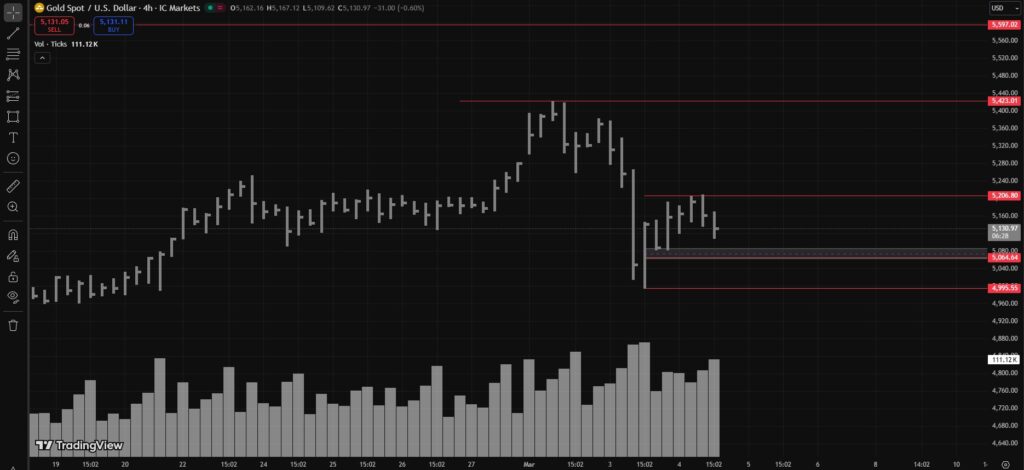
Alright guys, here’s the updated scene, on March 4, 2026, XAUUSD aka Gold has already printed a High around 5206, a Low around 5083, and is currently trading near 5114. (Please note: By the time I took the following screenshot, the price went up to 5130.)
As I mentioned in the previous analysis, bulls already grabbed roughly 50–70 pips intraday. And since price has pushed back inside the 5152 zone again, the real question now is: what’s the next plan?
Now we’re zooming out from M30 to the H4 timeframe to get the bigger picture.
On H4, 5206 will now be considered the Automatic Rally (AR) High. You can also call it the Creek or simply immediate resistance — same battlefield, different names.
XAUUSDs H4 Structure Outlook
According to H4 structure, Gold currently appears to be in Phase A. The Secondary Test (ST) is still pending.
I’m expecting the ST somewhere between 5085 to 5063. And yes, 5063 is the same immediate support zone I discussed in the previous M30 analysis.
Once the ST completes, Phase A should be considered complete — and that’s when Phase B begins.
Naturally, after an ST, price tends to move back up to test resistance. So after ST completion, look for SOS (Sign of Strength) confirmations on lower timeframes for potential long entries around those zones.
Important: It’s not mandatory that ST happens exactly at my mentioned levels. The market can always go for a deeper test. Gold doesn’t care about our feelings.
If H4 Moves into Phase B

If my analysis plays out and Gold transitions into Phase B on H4, then bears should start looking for SOW (Sign of Weakness) somewhere near 5206.
Now here’s where it gets interesting:
Scenario 1 – Clean Bullish Breakout
If Phase B sees a breakout above 5206 without forming a Spring, then we apply the same method from the previous analysis:
Jump Across the Creek > Test > Up Rally. Classic Wyckoff continuation.
Scenario 2 – Bearish Flip (Redistribution)
If we get a UTAD + Test at 5206 during Phase B, then bias flips bearish. In that case, the range will be treated as redistribution.
- First target: ICE
- If ICE breaks + proper Test > Next major target somewhere near 4800
Translation: Trap breakout buyers up top… then gravity takes over.
Scenario 3 – Spring Formation (Bullish Bias Intact)
If in Phase B, price tests resistance, then drops and forms a proper Spring, that means Phase B is complete and Phase C starts, bullish bias remains intact.
- First target: 5206
- Break above 5206 + Test (Jump Across the Creek) > Next target around 5400
Exact second targets after UTAD or Spring can be calculated more precisely once those structures actually form. Until then, the projected 4800 or 5400 zones are educated estimates.
TL;DR
- H4 is currently in Phase A
- Expecting ST around 5085–5063
- ST complete > Phase B begins
- Break above 5206 cleanly > Bullish continuation
- UTAD + Test at 5206 > Bearish > Target ICE > Possibly 4800
- Spring > Bullish > Target 5206 > Then 5400
In short: Gold is approaching decision time. Either it respects structure… or it creates emotional damage for both bulls and bears again.
Disclaimer
This is not financial advice. I am just vibing with charts, zooming in and out of timeframes like a Netflix series, and sipping chai while pretending to understand liquidity psychology.
If Gold does the exact opposite of this analysis, please do not blame me. Blame smart money, liquidity providers, central banks, market makers, your broker, your internet connection, Mercury in retrograde, or your own FOMO.
Trade safe. Or at least trade consciously.
Discover more from MAMKTRADERS.COM
Subscribe to get the latest posts sent to your email.