Alright paijaan, so the scene is something like this. XAUUSD aka Gold is pretty much behaving more or less the same way I explained in the previous analysis.
However, a few new developments appeared during the week, and they deserved a proper mention. So I thought, why not share the updated battlefield map with you guys.
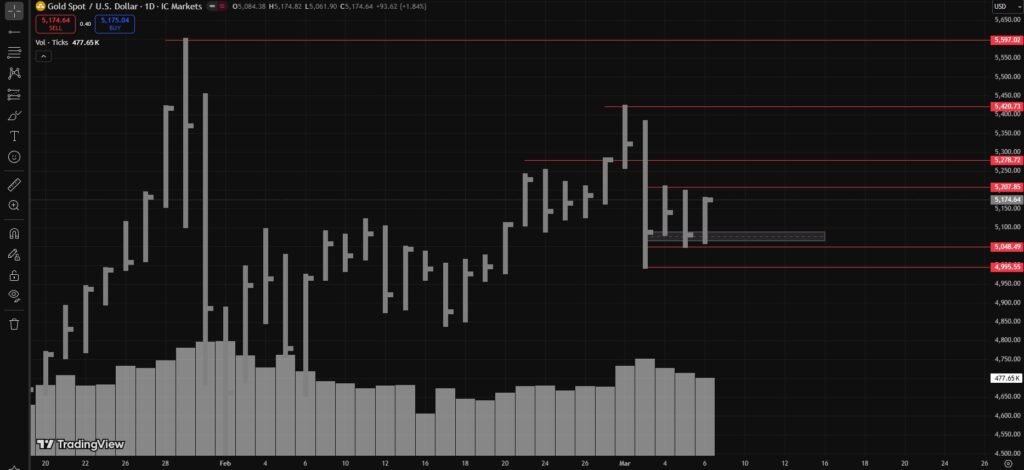
So bhailog, the weekly market for XAUUSD closed on Friday, March 6, 2026.
During the week, Gold printed roughly:
- High: around 5420
- Low: around 4995
- Weekly Close: around 5174
Now compared to the previous week, yes technically we got a down closing. But if you actually look at the structure and the volume behavior, the market was basically showing a tug of war between supply and demand the entire week — and this happened with Ultra High Volume (UHV) according to the ICMarkets chart.
Translation: big money was clearly active. This wasn’t retail traders fighting over $5 positions.
Daily (D1) Perspective

If we zoom further into the Daily timeframe, Friday’s closing structure printed a 2-bar reversal with Lower Effort vs Higher Result toward the Creek.
In simple Wyckoff language, that usually means demand is still pushing price upward despite relatively lower effort aka “No Supply.” So the path of least resistance still looks bullish for now.
H4 Perspective – Something Interesting Happened


Now let’s zoom into the H4 timeframe. The H4 bar on March 6, 2026 at UTC 15:02 showed Higher Effort vs Lower Result, which normally raises some eyebrows.
However, the very next Test Bar at UTC 19:02 closed above its high with very little effort. Yes, the difference was only $2–$3… but in Wyckoff terms, that kind of behavior actually matters.
So bhaijaan, momentum still appears bullish.
Previous Analysis vs Current Reality
Now let’s compare this with my previous analysis.
In the last article, I mentioned the 5064 level as an important level for a potential Secondary Test (ST) in Phase A. But what actually happened is slightly different.
That level was not tested in Phase A. It was tested after Phase B had already started. When I wrote the previous analysis, ST1 was actually forming in real time.
ST1 eventually confirmed at 5108, followed by a successful test at UTC 19:02 on March 4, 2026, and price moved upward to test the lower resistance of the Creek.
So according to my current interpretation:
Phase B started after the successful test of 5108.
The Deeper Test
As I also mentioned previously, the market can always go for a deeper test. And guess what? Gold did exactly that.
Price dropped and printed a low around 5050. From there:
- Demand stepped in
- Supply got absorbed
- The H4 bar closed at 5074
Then we got a successful test, and price started moving upward again.
Later on, price revisited around 5060, but interestingly it never closed below 5087. So in my opinion, that move was likely just stop hunting.
Classic market behavior. Shake weak hands out… then continue the game.
After that, the market went on to close both Daily and Weekly at 5174.
Selling Climax Observation (GC1! vs ICMarkets)


Now here’s another interesting detail.
If we compare the GC1! futures chart with the ICMarkets chart, something slightly unusual appears. Technically the Selling Climax occurred on March 3, 2026 on the H4 bar at UTC 15:02, which printed the 4995 low.
But the Ultra High Volume actually appeared on the previous bar, which on ICMarkets printed roughly:
- Low: around 5014
- Close: around 5048
Then the next bar showed decreasing volume and created the Automatic Rally, which first dipped to 4995, and then rallied up to close near 5140.
Classic Wyckoff behavior.
Lower Timeframe Insight – Spring?

Now if we zoom even further into the M15 timeframe, something interesting happens. The Creek shifts upward to around 5226, and the 4995 low can actually be interpreted as a Spring.
Which means something important.
The 5050 test on H4, which closed around 5073, could actually be interpreted as the test of that Spring on M15 and M30.
There are actually a few more technical observations here… but if I go deeper into that rabbit hole, this article will start sounding like a PhD thesis in Wyckoff theory. And I’m not sure if the average reader signed up for that level of emotional damage.
So for now, we’ll keep it simple.
By the way guys, what I’m calling a “Spring” on M15 is really just the internal behavior of the H4 Selling Climax. On H4, the SC low is 4995, but if you zoom in on M15, that same SC shows a high at 5060 and closes near that high followed by a Successful TEST.
So technically, it’s not a separate Spring — just the micro-action inside the SC, showing demand stepping in and absorbing supply. Classic Wyckoff liquidity sweep, but in miniature.
Key Levels Right Now
So bhaijaan, the updated battlefield looks like this:
- Creek: 5226
- Immediate Resistance: 5207
- ICE (Support): 4995
And according to the H4 structure, the market currently appears to be in Phase B of Accumulation.
Bullish Scenario
Now here’s the interesting part. If the market Jumps Across the Creek (5226) while still in Phase B, and sustains above it with a successful test, then Phase C might actually get skipped.
Which means we could jump directly into Phase D. If that happens, the first potential minimum target could be somewhere around:
5450
Yes… Gold likes dramatic moves.
Alternative Bullish Path
Now let’s say the market fails to break 5226 and instead forms a fake breakout or an Upthrust near 5207.
Even then, my bias would still remain bullish, provided key support levels remain unbroken. In that scenario, price may come down and possibly break the 5064–5050 support area.
And that’s where I would start looking for a proper Spring pattern. Ideally something like:
- Price breaks below the ICE near 4995
- Quickly closes back inside the range on H4
- Followed by a successful test
That would be Phase C of Accumulation.
After that:
- Phase D: Jump Across the Creek
- Successful Test
- And then… Gold probably goes on another adventure to the upside.
Bearish Scenario
Now let’s talk about the situation where things go wrong.
Suppose the market aggressively jumps across the Creek during Phase B, but then runs into heavy supply around 5278–5280.
If that area produces a UTAD (Upthrust After Distribution) at the CREEK or below the CREEK followed by a successful test, then bhaijaan… I might be forced to flip my bias.
Yes, even traders have to admit when the market slaps them.
In that case, I would consider short positions, but very cautiously.
Why cautiously?
Because the Middle East situation is still tense, especially with the Iran vs Israel and US situation, and Gold tends to behave like it drank five cups of coffee whenever war scenarios appear.
If the UTAD confirms, my potential downside targets would be:
- First target: 5050
- Second target: 4995
- Third target: around 4770
But again — this scenario requires proper confirmation.
Final Thoughts
So bhaijaan, to summarize the current situation:
- H4 timeframe still shows Accumulation
- Creek has shifted upward to 5226
- Immediate resistance sits around 5207
- ICE support remains at 4995
- And according to current structure, the market appears to be in Phase B
Everything else still follows the same formula from the previous analysis.
If price Jumps Across the Creek (5226) and successfully tests it, Phase C could be skipped and Phase D could begin, with a minimum upside target around 5450.
But if price fails at resistance and forms an Upthrust, we may see another downward move toward a potential Spring formation near the ICE before the real bullish move begins.
TL;DR
- Gold appears to be in Wyckoff Accumulation Phase B on H4
- Creek shifted to 5226
- Immediate resistance: 5207
- ICE support: 4995
- Break and successful test above 5226 → Phase D → Target around 5450
- Failure near resistance → Possible Spring near 4995 → then bullish continuation
- Bearish case only activates if UTAD forms near or the CREEK at 5226
Disclaimer
This is not financial advice. I’m just a random guy staring at charts, drawing imaginary lines, whispering “absorption” and “liquidity” to myself while drinking chai and pretending I understand what smart money is doing.
If Gold completely ignores this analysis and does the exact opposite, please direct all complaints to, Central banks, Market makers, Liquidity providers, Your broker, Your internet connection, Or your own FOMO.
Trade safe. Or at least trade consciously.
Discover more from MAMKTRADERS.COM
Subscribe to get the latest posts sent to your email.